Knowledge in one place.
By Rogério Pereira – Application Engineer
The growth of Internet Service Providers (ISPs) networks requires managers to use techniques and tools that help keep their equipment operational, avoiding unavailability of services. A very important resource for this context is remote monitoring in order to proactively identify equipment failures and act in advance to avoid significant damage to users.
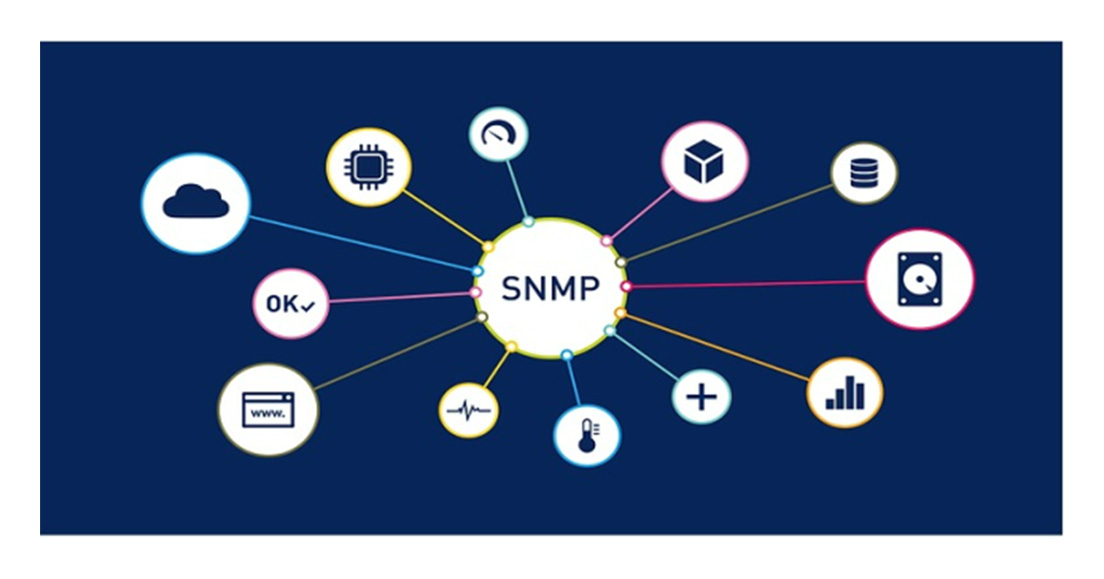
Equipment monitoring is the process of collecting and organizing information in real time from the different devices that make up an IP network infrastructure, in order to ensure that it is working correctly.
In this article, we will demonstrate the use of open source market management software called Zabbix, which is widely used by our customers. Additionally, we will also demonstrate the use of the Grafana software, which, integrated with Zabbix, allows you to view all information in dashboards.
Before entering the tutorial, we will generically explain the process of monitoring network equipment.
Concept
Using comprehensive monitoring software, administrators can track and observe the performance, connectivity, availability, utilization and security of IP networks. Monitoring can cover physical components of the network (for example, servers, routers, firewalls, switches, etc.), applications (connection and availability of applications, services, etc.), as well as virtualized environments and data traffic.
Some of these tools allow users to configure alerts that are displayed on a dashboard that can be customized according to each one's preferences, in addition to the possibility of sending these alerts via email, SMS, among others.
The monitoring server maintains the history of data collected in a database (Oracle, MySQL and PostgreSQL, among others), from where graphs, monitoring panels and slide-shows are generated that show information alternately.
Monitoring tools share basic characteristics such as:
There are various tool options available on the market, some paid, others free. Among them, DmView stands out, which is the management software developed by Datacom and provides full support for the entire line of Datacom equipment. Below, we list some of the most well-known:
In addition to equipment monitoring functionalities, DmView offers CLI templates, TR-069 templates, configuration, end-to-end provisioning with path discovery, supervision, fault management, OAM (Operations, Administration, and Maintenance), inventory, user administration, security, auditing, performance and traffic monitoring, topological maps, network discovery, and self-management functionalities.
Furthermore, DmView includes TR-069 management services and functionalities, acting as an Auto Configuration Server (ACS) for the TR-069 protocol. This allows the management of the TR-069 CPE (Customer Premises Equipment) network through functions for viewing and searching CPEs in the network, viewing and searching CPE parameters, configuring CPE parameters, rebooting, and updating firmware and configuration files.
For more information about DmView, visit the link https://www.datacom.com.br/pt/produtos/gerencia-de-redes/dmview.
Conventionally, such management is carried out through SNMP (Simple Network Management Protocol) agents. SNMP is a protocol that helps network administrators manage devices and troubleshoot network issues. It is based on two main elements: manager and agent. The SNMP protocol has three versions:
Original version of SNMP, community strings sent in plain text with weak security.
Version developed to fix some of the issues in v1. However, several versions were developed, none truly addressing the issues with v1. Version v2c is the most used version and has improved protocol handling over version v1, resulting in slightly improved operations. However, security is still an issue because it uses plain text community strings.
Latest version of SNMP, supporting full SHA and MD5 security and authentication. It should be used if possible, especially on untrusted networks.
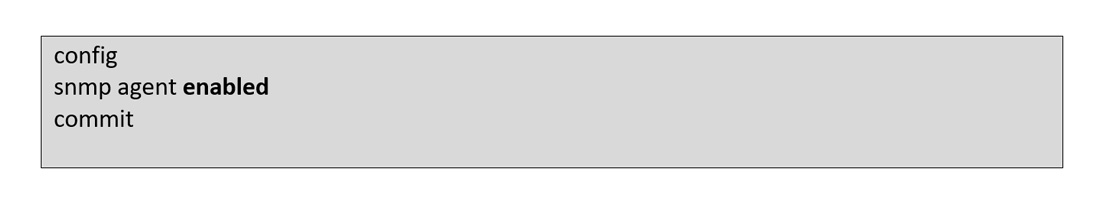
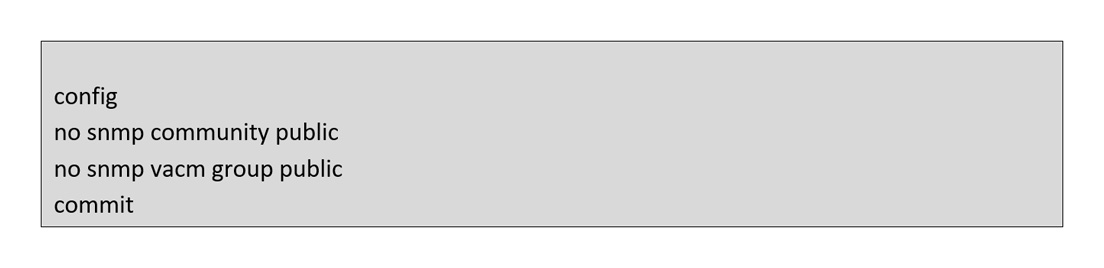
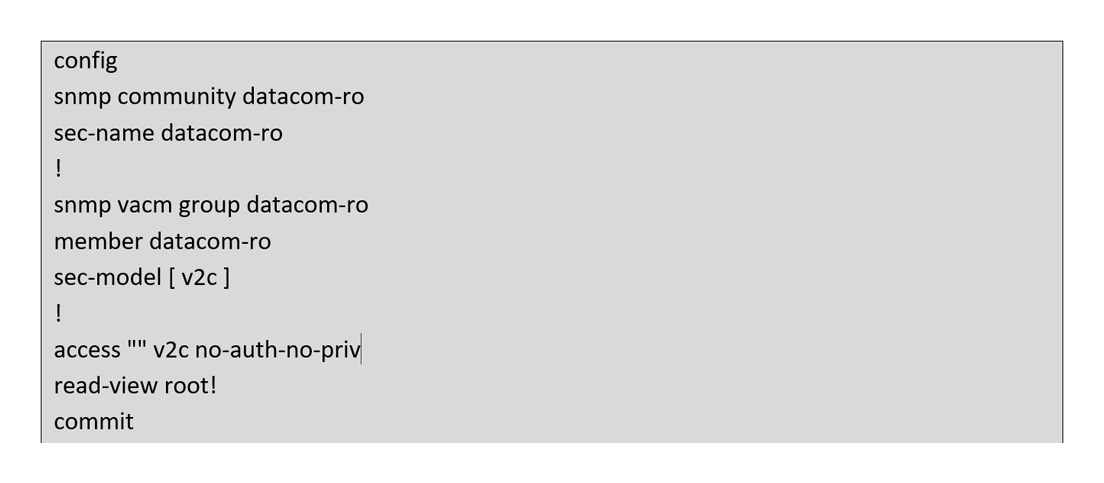
The default SNMP configuration of Datacom DmOS products is factory set to public with read, write and notification permissions for SNMPv2. For security reasons it is recommended to change the default community. If the user wants to remove or add a new community, the following steps will demonstrate how to carry out these operations.
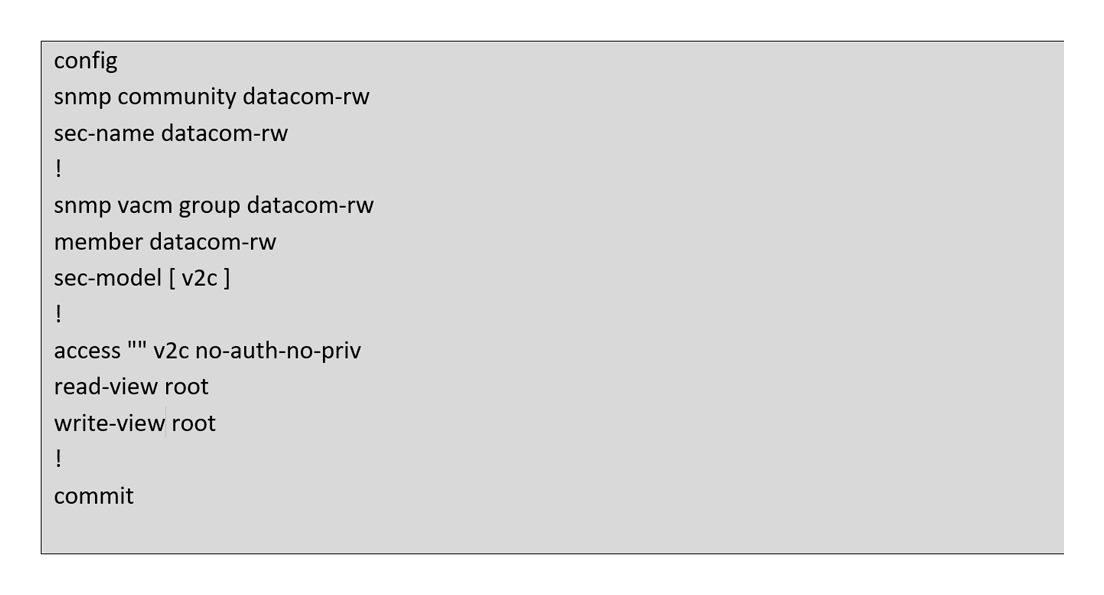
Managed objects can have read and write permissions, and each read will represent the real state of the resource, and each change will also be reflected in the resource itself. The set of these objects is called MIB.
MIB (Management Information Base)
A MIB (Management Information Base) is a hierarchical database used to facilitate the management of devices on a network. Each MIB is addressed using an object identifier (OID), which is usually the configuration or status of a device. The OID uniquely identifies a managed object in the MIB hierarchy.
In a simplified way, the settings and status of the device have a unique numbering (OID), which is the identifier of the object. This numbering is used by SNMP to read configurations and status, for example, the status configuration of an interface has an OID that, when consulted by SNMP, will return whether the interface status is UP or DOWN.
The MIB concentrates all the OIDs available to be consulted, in addition to translating this numbering into a name, so when using the MIB instead of consulting the OID, it is possible to consult the name used for that OID.
The MIB organization uses a tree architecture with abstract syntax notation in order to make the exchange of information between different systems compatible, regardless of the equipment in which it is being implemented. For each object are defined: name; identifier; syntax; definition and access:
Access defines the type of control you can have over the object, which can be read-only, read-write, or not accessible.
Basically three types of MIBs are defined: MIB II, experimental MIB and private MIB. MIB II provides general management information such as the number of packets, interface status, CPU consumption, among others. An experimental MIB is one in which its components are in the development and testing phase. The private or proprietary MIB must be provided by the equipment manufacturer, it contains specific information from each manufacturer such as configurations, proprietary protocols, among others.

Zabbix
Among the free tools, Zabbix is one of the most used by ISPs, and its main objective is to monitor network availability, user experience and quality of services in real time.
Offers a 100% Web interface for administering and displaying data. It supports polling and trapping, alerts can be configured to use various methods of communication, such as SMS, email and opening tickets in helpdesk systems.
It also has auto-discovery functions (automatic discovery of items) and for this you must use templates, you can find them on GitHub (Here at this link), where we provide the templates to monitor our DmOS equipment.
Datacom has DmView Maestro, which is an Integrated Network and Element Management System developed to supervise and configure Datacom equipment. DmView can be integrated with the Zabbix software so that access to equipment monitoring charts can be performed directly through shortcuts created automatically in the DmView Web interface (for more details, consult the DmView Maestro Software documentation).
The main modules of the Zabbix monitoring system are:
Zabbix server
The Zabbix server collects data for agent monitoring. When any situation is detected, alerts are issued visually and also through the use of communication systems. The server keeps the history of the data collected in a database (Oracle, MySQL and PostgreSQL). These are used to generate charts, dashboards and slideshows. The system must be installed on Unix or Linux systems.
Zabbix proxy
The Zabbix proxy basically works on behalf of the Zabbix Server, in the view of the monitored agent, the proxy becomes the Zabbix server. Received data is temporarily stored and sent to the server. Once sent, this temporary data is deleted. The use of this component is optional, however it is considered an essential item for a distributed monitoring architecture, as it distributes the monitoring load. If all data collection is done through Proxies, CPU and I/O usage on the server responsible for the Zabbix server is significantly reduced.
Some reasons to use Zabbix proxy:
– Reduction of the load on the Zabbix server;
– Allow monitoring in DMZ zones or behind firewalls;
– Data storage in the database in case the connection to the public network is interrupted;
– Makes monitoring more effective;
– Work as a point of resilience in cases of instability in the links between different networks;
Zabbix agent
The Zabbix agent is installed on the monitoring target host and allows to actively monitor local resources and applications such as CPU and memory. In addition, the Zabbix agent allows the collection of personalized metrics using scripts or external programs, allowing the collection of complex metrics and even taking actions directly in the Zabbix agent itself. The agent gathers local information about the monitored device for later sending to the Zabbix server or proxy.
There are Zabbix agents available for Linux, Solaris, HP-UX, AIX, FreeBSD, OpenBSD, OS X, Tru64/OSF1, Windows NT, Windows Server, Windows XP and Windows Vista.
An important note is that this module is only used for servers.
web interface
Taking into account that the devices and services to be monitored are in a network environment, the Zabbix application has a web interface, accessible through any browser, making it possible to manage Zabbix through this interface. In the image below, you can see the main screen of the Zabbix Server, where you can see the 'Dashboard' of the 'In Monitoring' tab, a page that shows, in a practical and grouped way, a summary of the occurrences of the entire managed environment.
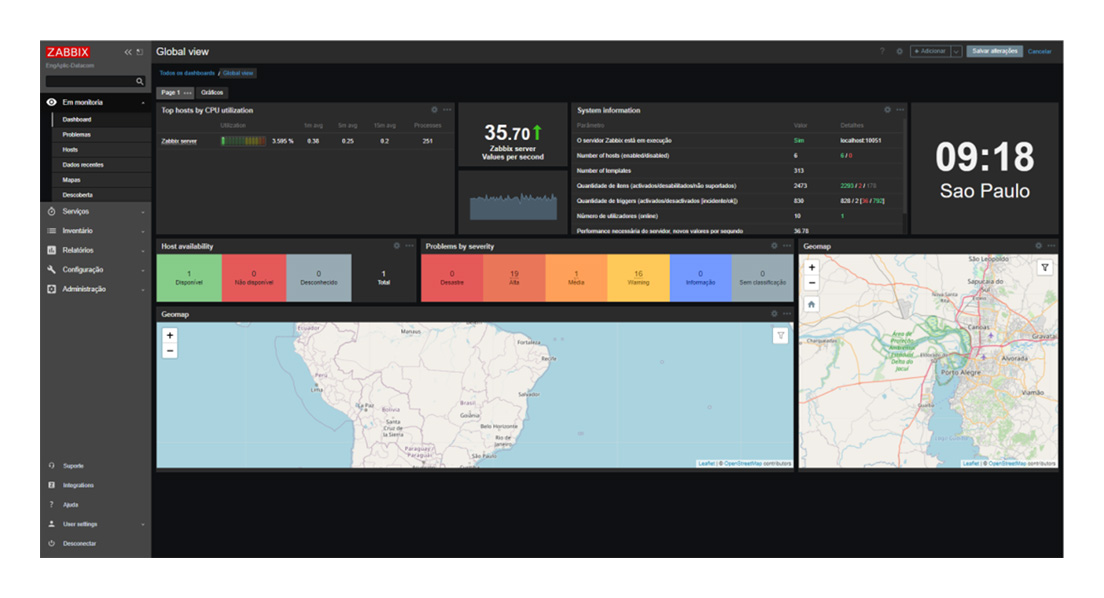
(Zabbix Global Screen)
Grafana
Grafana is a web interface software that helps you visualize data in a more visually attractive interface, allowing you to display the data/metrics collected by Zabbix in dashboards created in Grafana.
The integration between Grafana and Zabbix tools is carried out through a plugin that must be installed in Grafana, it is responsible for allowing the creation of a datasource that will communicate with the Zabbix API. With the Zabbix API it is possible to develop various activities from queries, task execution and integration between systems.
In addition to being a great free and open source solution, it has integration with several solutions in addition to Zabbix, such as MySQL1, GLPI2, PostgreSQL3, Google Agenda4, InfluxDB5, among others. Thus, it is possible to assemble a visual panel with different data from different collection sources. An example of this would be a single support center monitoring panel, with information on key service metrics. DATACOM provides a Grafana JSON template (Contact technical support) where it is possible to validate some information:
(Dashboard created in Grafana)
Zabbix and Grafana in practice!
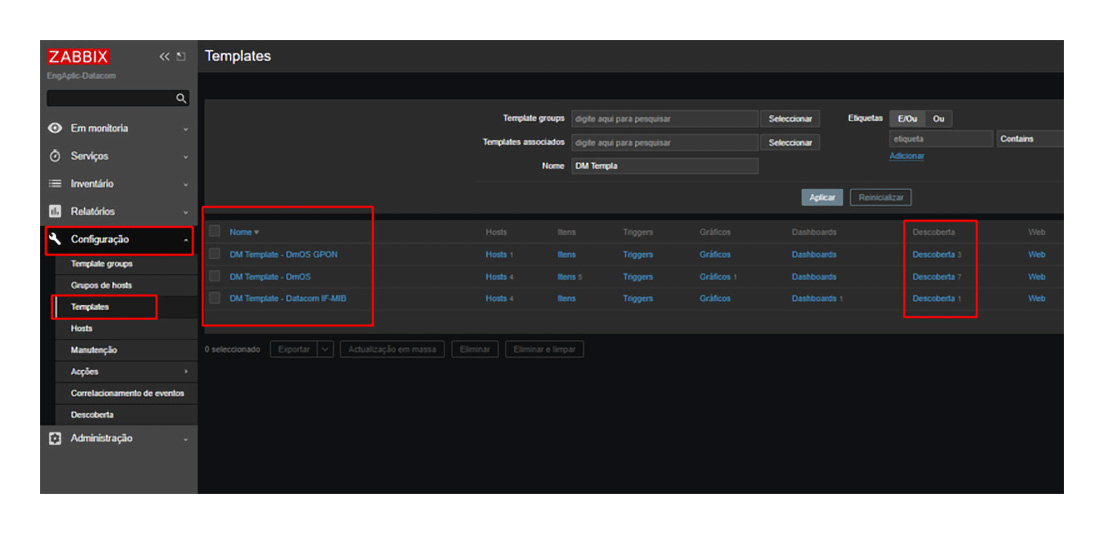
Now, we will demonstrate the use of Zabbix with Datacom OLTs and ONUs, analyzing several parameters such as, for example, processing and memory of the OLTs, number of active ONUs per PON port, among others. As mentioned, Zabbix performs the automatic discovery of items, and for this it is necessary that a template be created, imported or even used a pre-existing one. For devices with DmOS, we provide 3 templates, they are divided this way for organization reasons and also because it is not necessarily necessary to use all templates for all devices. We recommend that only the most relevant items be monitored and that are strictly necessary for the control of your network. Monitoring items in excess or at a high query frequency can end up causing high CPU consumption on the equipment, in addition to the use of server resources, which is another important factor to be taken into account.
There are some items in the templates that are disabled, as they are considered of low relevance, but they can be useful in some cases. Below are the templates provided by Datacom:
DM Template - Datacom IF-MIB
Items related to interfaces, such as:
DM Template - DmOS
Equipment-related items, such as:
DM Template - DmOS GPON
GPON related items such as:
Next, we present a step-by-step guide for using Zabbix and Grafana with OLT/ONU Datacom. For this example, we use Zabbix version 6.2.1 and Grafana v9.1.4.
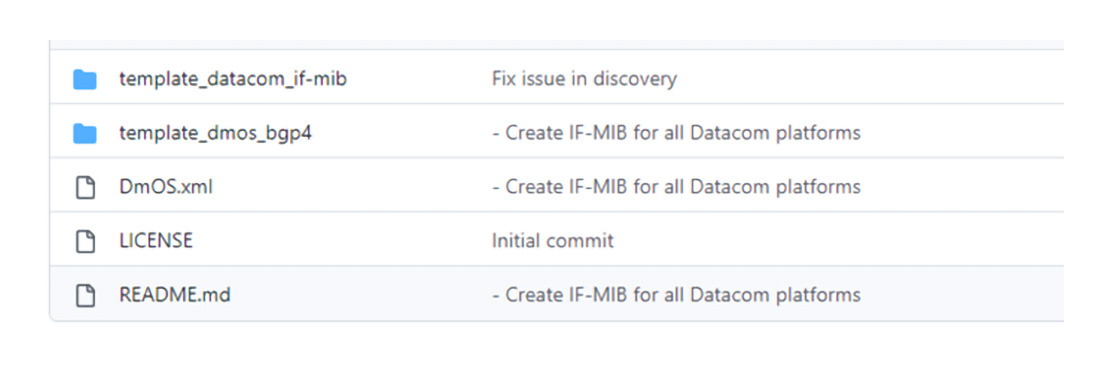
1 – Download the Zabbix templates for OLT/ONU Datacom:
Datacom makes the templates available on Github, at the link:
https://github.com/datacom-teracom/dmos-zabbix-template
2 – Import the template in Zabbix according to the following images:
Click on “Configuration -> Templates -> Import -> Choose File” and select the desired template.

In case of success, the imported templates should appear as shown in the image below.
3 – Get the updated DmOS MIBs.
Using a TFTP server on your machine, access the DmOS equipment and execute the command below, the command will forward the file with the MIBs via TFTP protocol with the name datacom-mibs.tar.gz to the server.
copy mibs tftp://
4 – After exporting the MIBs as shown in the previous step, unzip the generated file and copy it to the Zabbix server folder (/usr/share/snmp/mibs/) with the SNMP package installed.
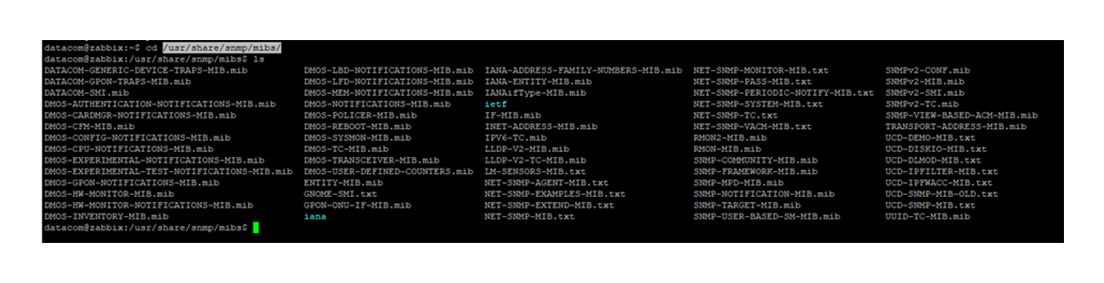
That's it, MIBs and templates imported on the server and on Zabbix.
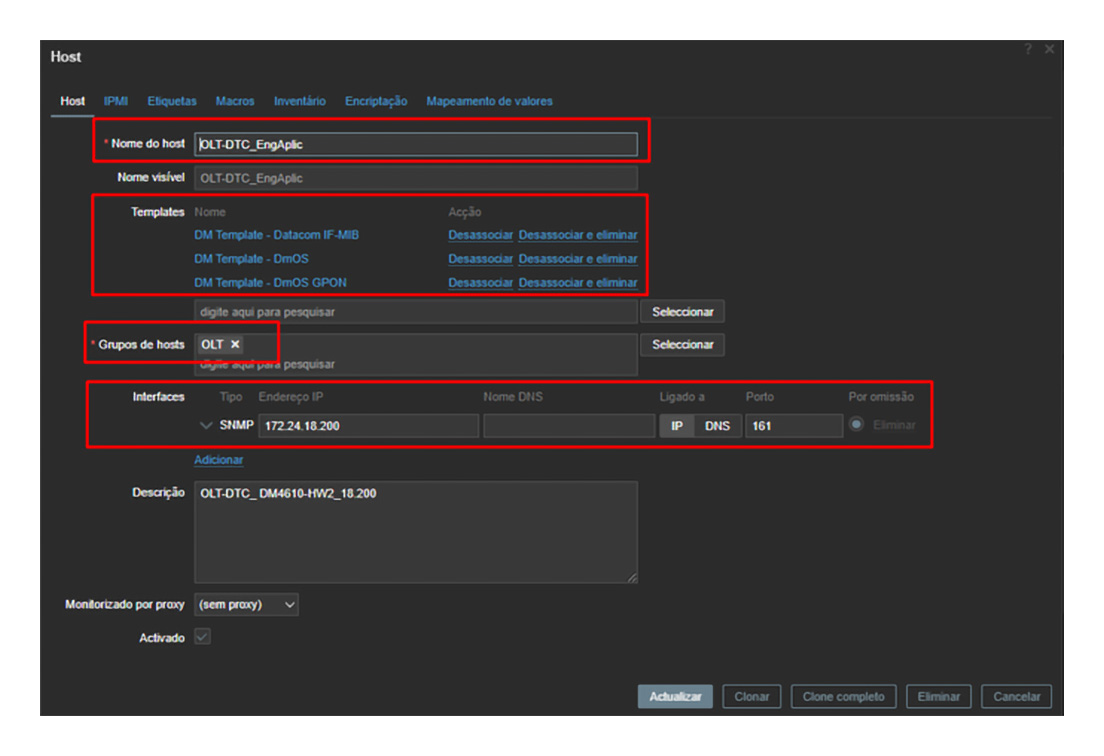
5 – Add a host in zabbix;
Click on “In Monitoring -> Hosts -> Create host”;
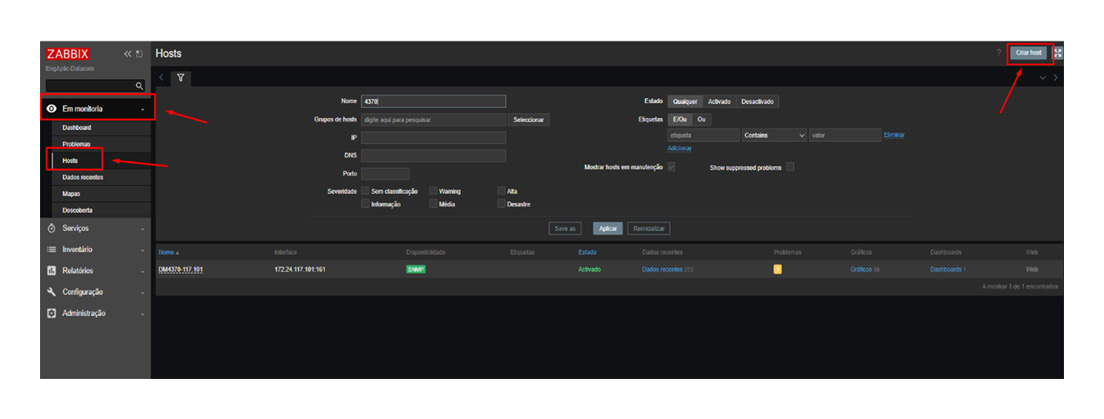
Fill in the flagged fields, add the templates that were previously imported and apply, your host is already added and will start discovering the items;
6 – Validate if the host items are being collected correctly;
Click on “In Monitoring -> Recent Data -> Host” Select the desired host;
The collected items will start to be listed on the screen, you can use the TAG VALUES to facilitate your search.
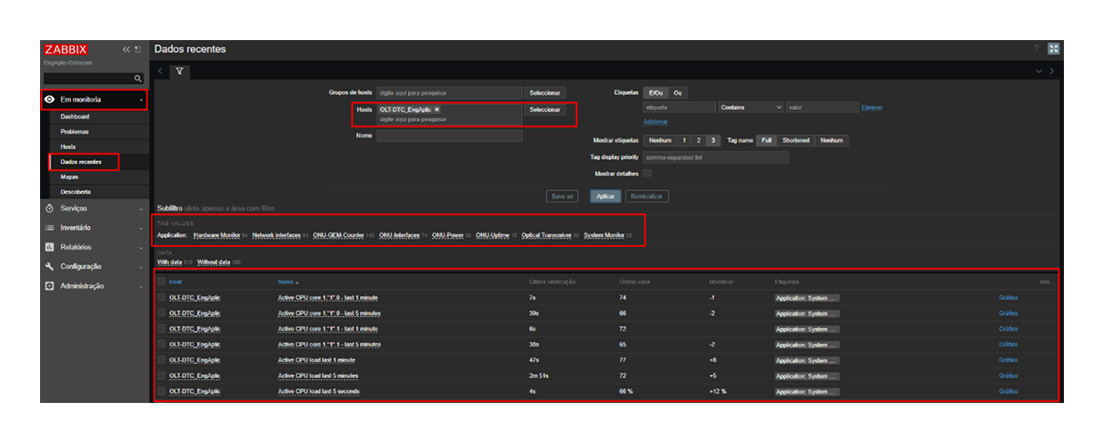
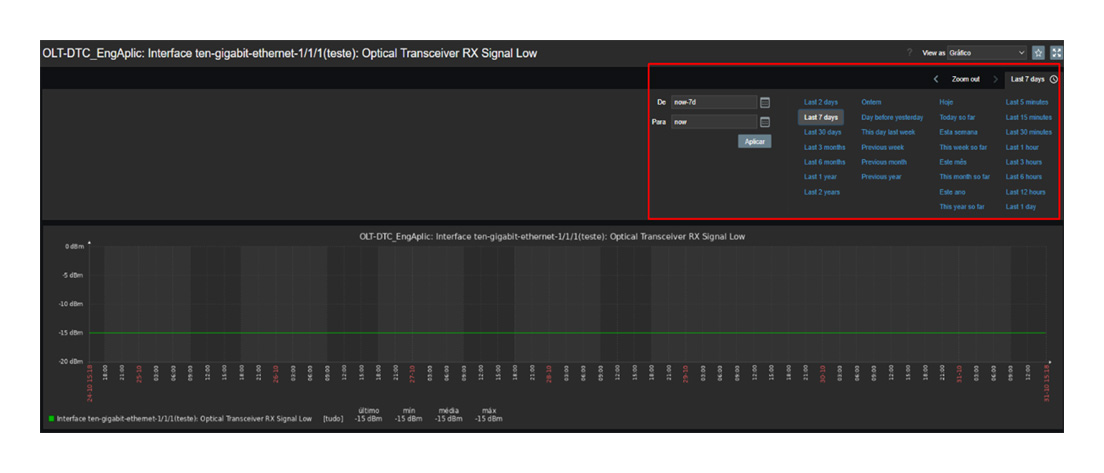
On the right side of each item there is a graph button where you can follow the collection history of the item, being able to inform the desired period;
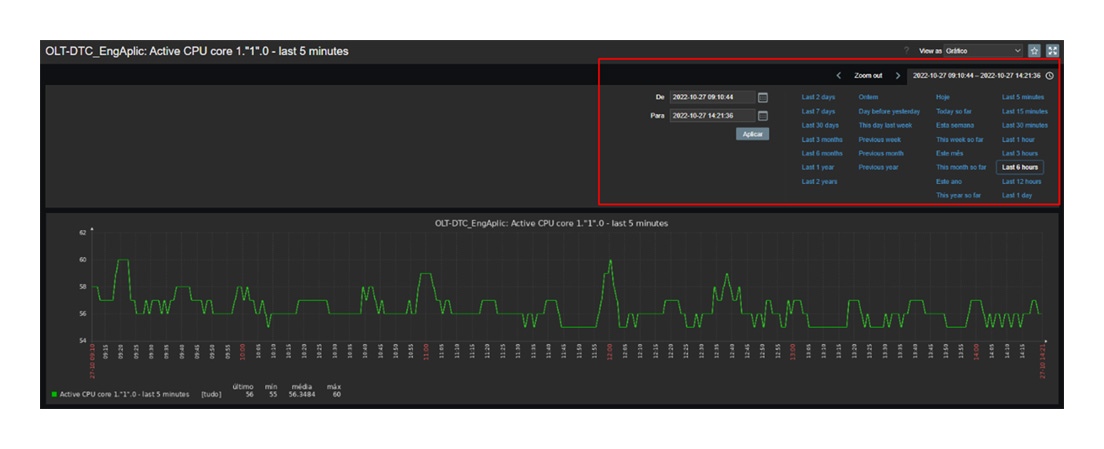
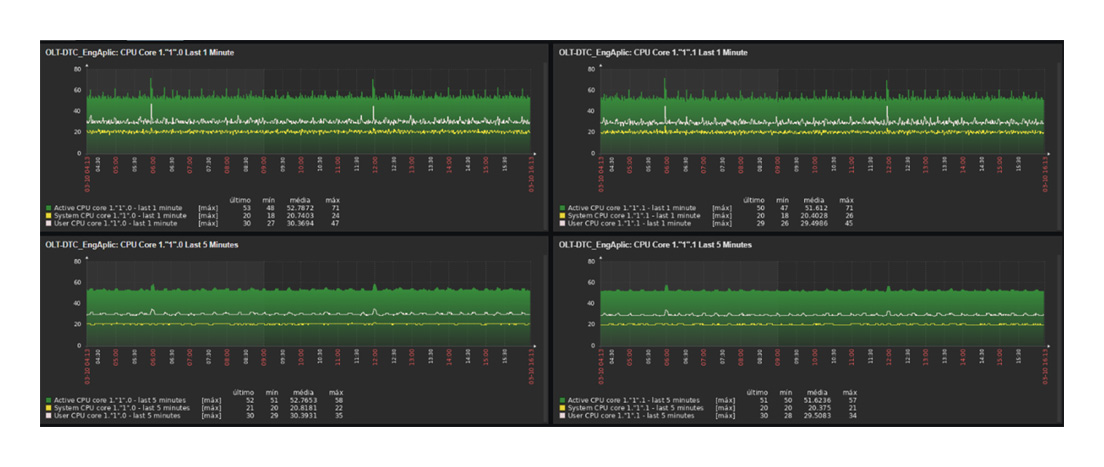
Example of CPU processing history:
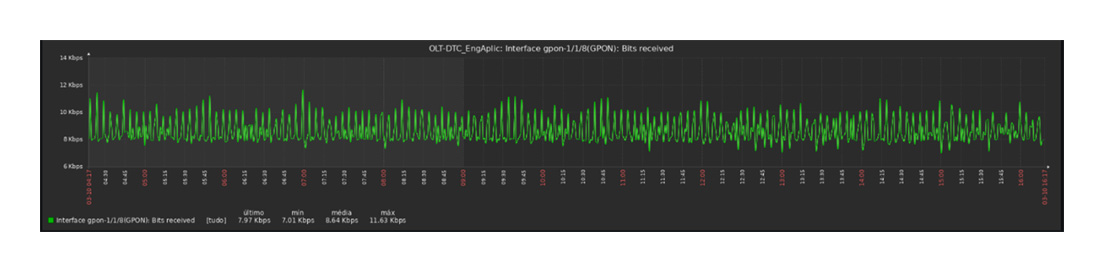
Example of GPON interface bandwidth history:
Example of transceiver power history:
7 – Download the Grafana template:
Datacom makes the templates available (Cantact Support):
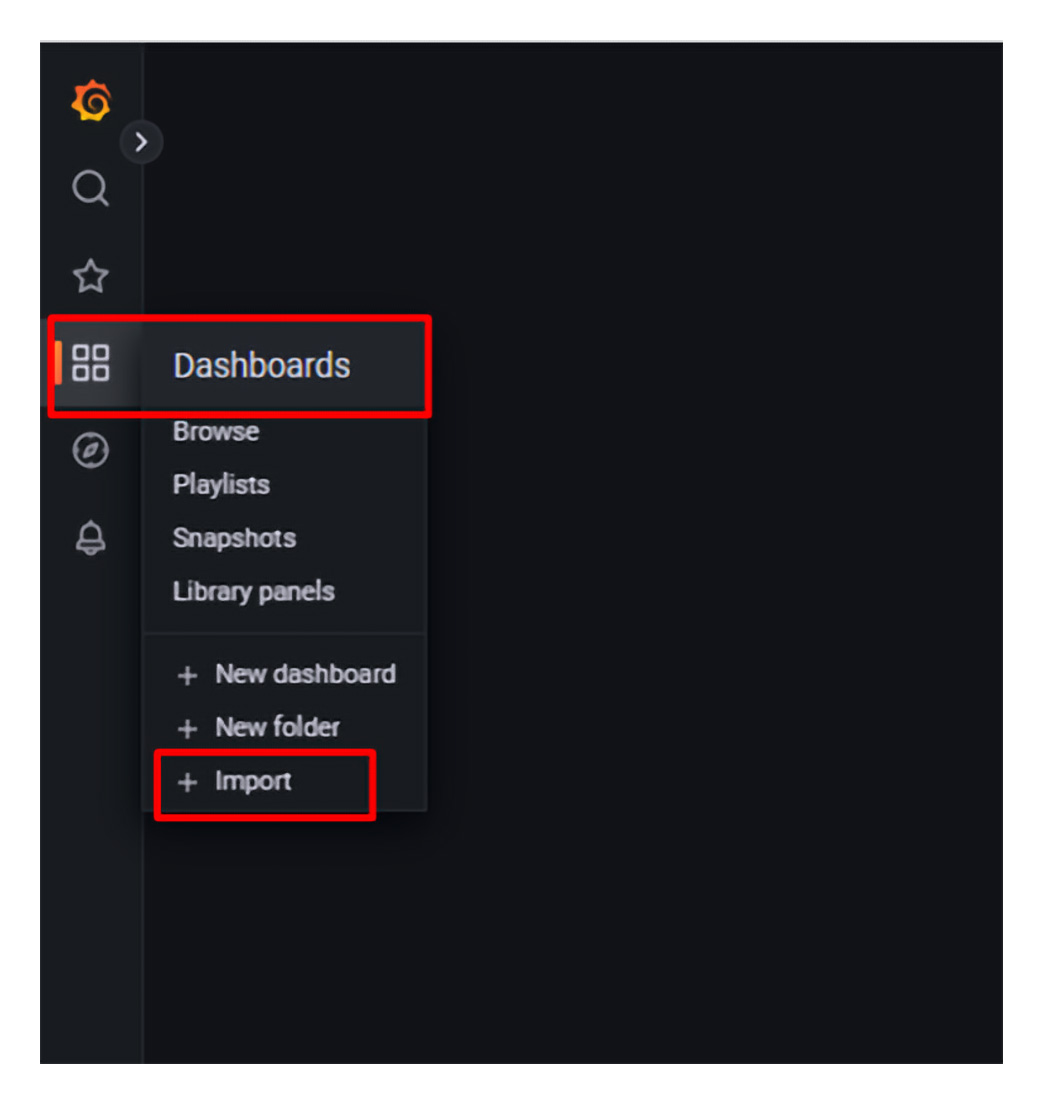
8 – Import the template into Grafana:
Click on “Dashboards -> Import”
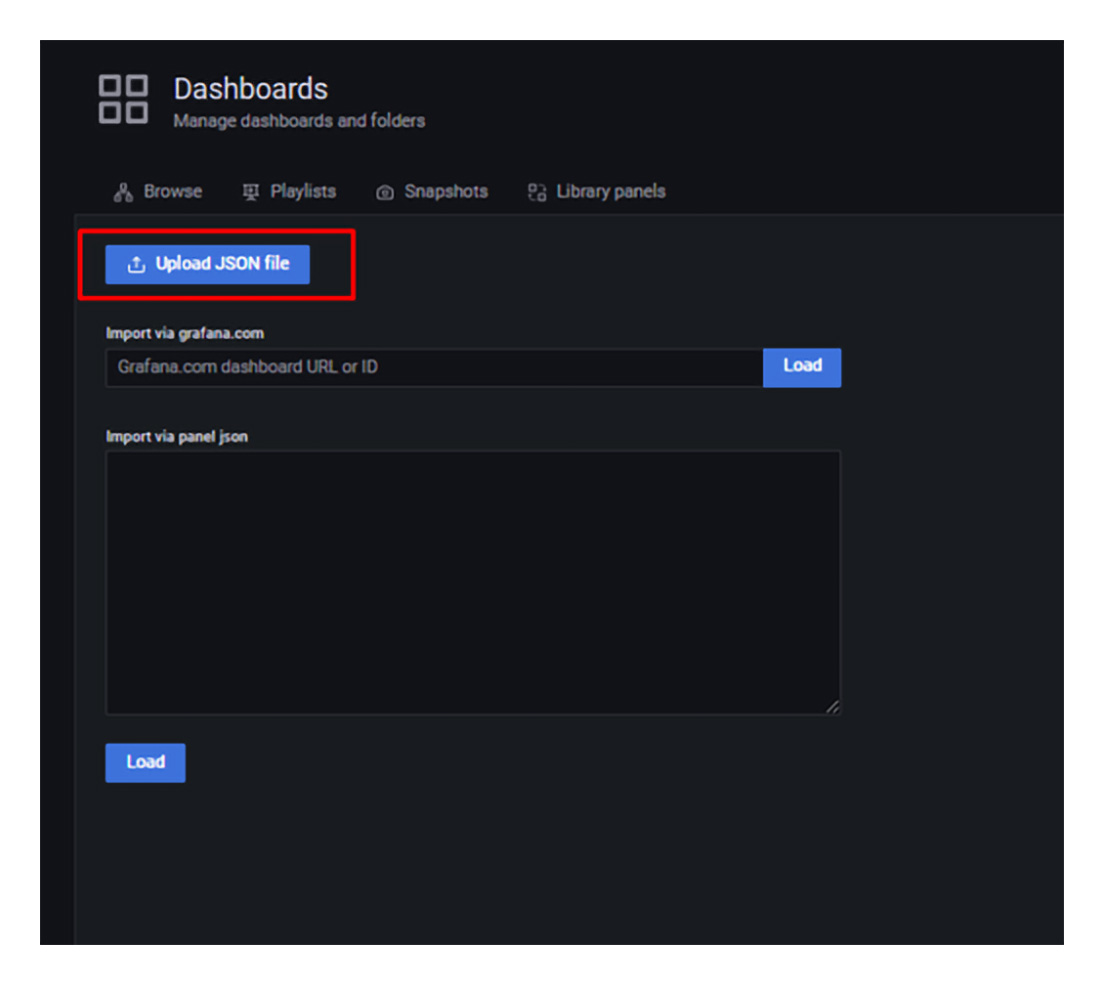
Click Upload JSON file and select the desired template.
9 – Define a name for your dashboard and click import;
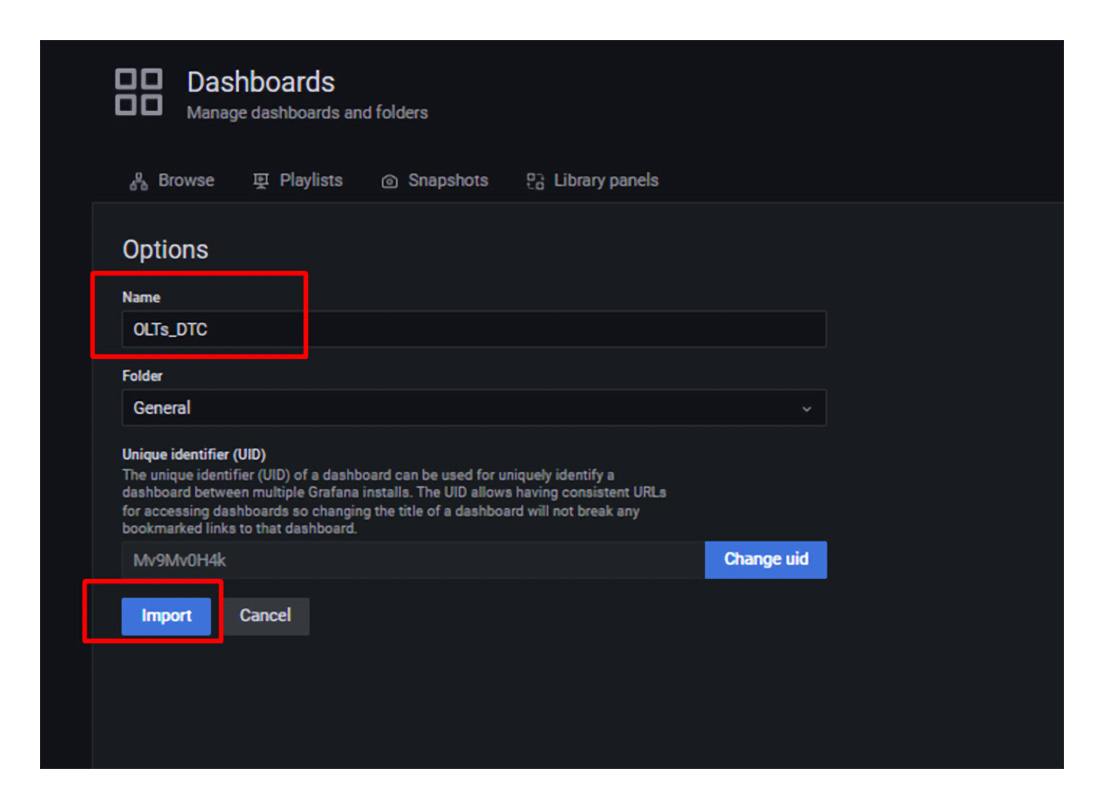
When you click import, the imported dashboard screen will automatically open:
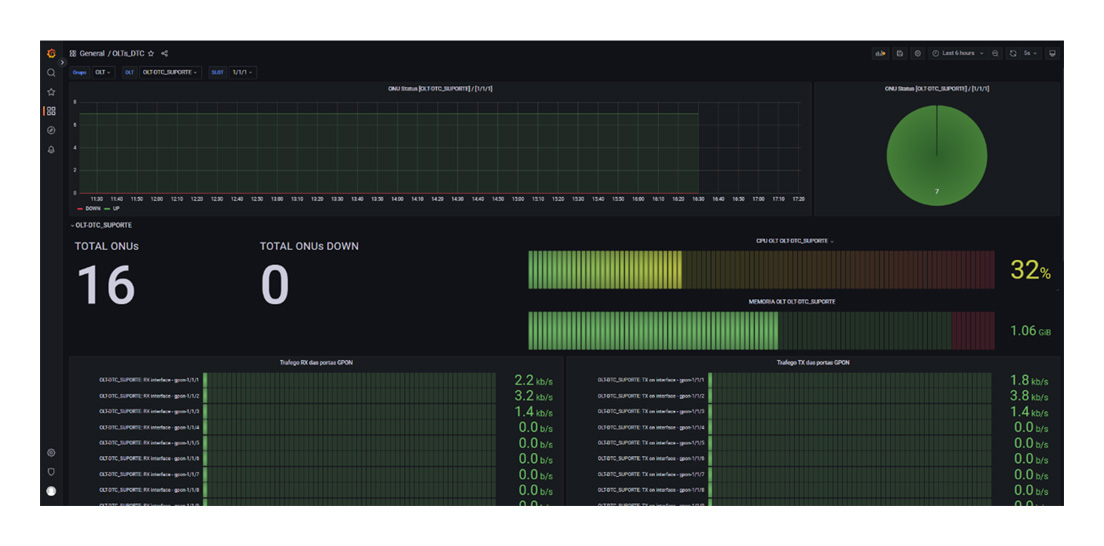
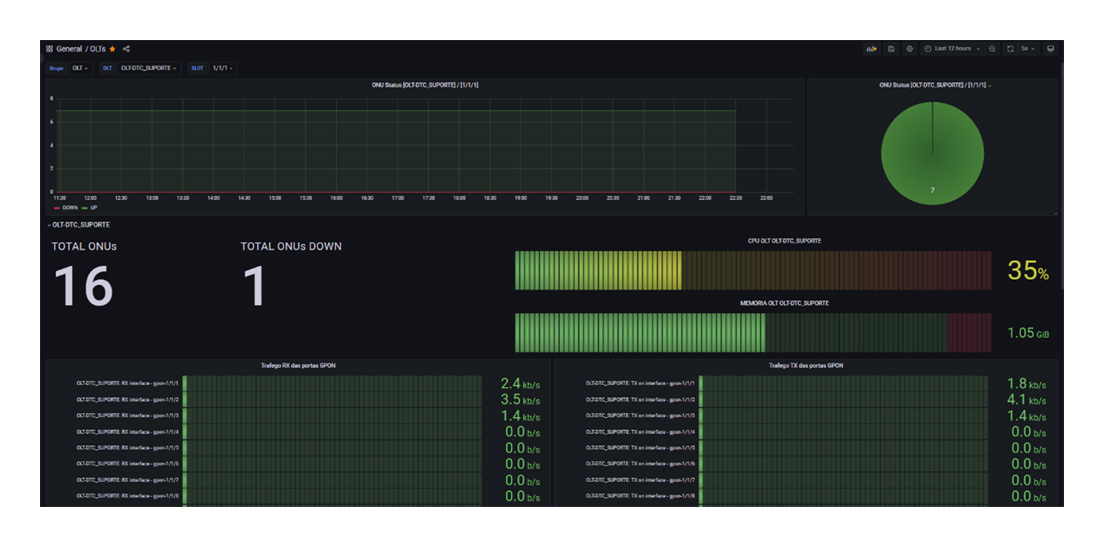
The Dashboard above shows the total online and offline ONUs per OLT and per PON port, CPU usage, memory usage, bandwidth usage of GPON interfaces, and bandwidth usage of Ethernet interfaces.
We thank the collaboration of the clients Giovani Cordova from the company GGNET and Josemar Fuzinatto from the company SCNET for providing materials for the preparation of this article.
For equipment configuration questions, you can contact Datacom's technical support team through our DmSupport self-service portal or through the call center (+55) 51 3933 3122.
Follow our blog, we always bring news of products and relevant technical content for your business.
Follow Datacom on social networks and also subscribe to our YouTube channel, mark the receipt of notifications and share the link on your social networks.
For questions and proposal requests, please do not hesitate to contact Datacom's commercial team: [email protected], via WhatsApp from the account managers or (+55) 51 3933 3000.
Back to blog
